
Making a Full-Scene Infographic with SenseNova U1 Pro
A hands-on tutorial for SenseTime's flagship multimodal model U1 Pro: turn raw data into a deliverable 8K infographic and full-match panoramic visual, automatically.
Making a Full-Scene Infographic with SenseNova U1 Pro
A hands-on tutorial for SenseTime's flagship multimodal model U1 Pro: turn raw data into a deliverable 8K infographic and full-match panoramic visual, automatically.
At WAIC on July 18, 2026, SenseTime released its flagship image-creation model, SenseNova U1 Pro. It isn't yet another "text-to-image foundation model" — its positioning is very specific: a delivery-grade, natively multimodal agent foundation for long-horizon tasks, specializing in "turning data into visuals": infographics, panoramic visuals, data visualization, and long-form commercial graphics.
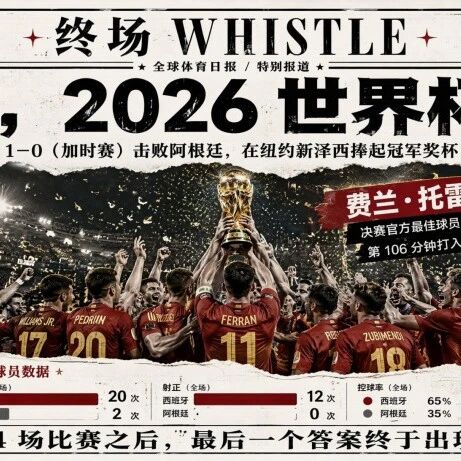
This tutorial runs on one concrete task: using U1 Pro + Raccoon to automatically turn a set of World Cup match data into a full-game panoramic recap graphic. The same path applies to year-end recaps, industry reports, product comparison charts, and any other "information-dense long graphic" scenario.
💡 How it differs from ByteDance's Seedream 5.0 Pro: Seedream focuses on photorealistic generation; U1 Pro focuses on infographics / panoramic visuals / data visualization, with a native interleaved image-text chain of thought. If your need is "a good-looking picture," go to Seedream; if your need is "making a pile of data make sense," go to U1 Pro.
Before You Start
- A SenseTime SenseNova account: register at https://www.sensenova.cn/
- U1 Pro model access enabled: select U1 Pro (Flagship) in the console
- Source material ready: text, long documents, spreadsheets, JSON data, or web links all work
- Expected time: 5–15 minutes per infographic; 15–30 minutes per panoramic graphic
Step 1: Hand the Material to Raccoon for Data Analysis
U1 Pro's panoramic graphics and infographics usually follow a two-step flow — first let "Raccoon" do the data analysis, then let U1 Pro produce the graphic. This step matters: feeding raw text straight into U1 Pro degrades the result.
- Log in to the SenseNova console and open Office Raccoon
- Create a new task and upload your source material (for example: full match data from a World Cup final, player statistics, and a timeline of key events)
- Tell Raccoon the analysis goal in natural language:
Based on the attached data, complete the following analysis:
1. Full-match comparison of possession, shots, and pass completion rate
2. Timeline of key events (goals, substitutions, red and yellow cards)
3. Highlight stats for the MVP players
4. The underdog team's upset trajectory (if any)

Output structured data tables for the subsequent visualization step.- Raccoon produces a structured analysis report (with data tables, key insights, and a recommended narrative structure)
💡 Tip: For the World Cup scenario, SenseTime's "Raccoon" also offers dedicated Skills (an AI office skills library) for vertical tasks like underdog prediction and full-final panoramic recaps. Enable them directly from the Skills list in the console.
Step 2: Call U1 Pro to Generate the Infographic
Once the analysis is done, hand the structured results to U1 Pro to produce the graphic.
Method 1: Web Console (Best for Beginners)
In the SenseNova console, choose "Image Creation → U1 Pro" and paste the Step 1 analysis report into the prompt:
Based on the analysis data below, generate a panoramic infographic of the World Cup final:

[Layout requirements]
- Landscape 8K ultra-HD (for print and posters)
- Top: the final matchup and score (with team crest colors)
- Middle left: full-match data comparison (radar chart + bar chart)
- Middle right: timeline of key events
- Bottom: MVP stat cards + underdog trajectory diagram

[Style]
- Modern sports-magazine look, dark background + team-color highlights
- Data points crisp, text no smaller than 24pt
- No redundant decoration

[Data]
{paste Raccoon's structured analysis output here}
Method 2: API (Best for Batch Production)
If you want to auto-generate a graphic for every match, use the API (Python example):
import requests

url = "https://www.sensenova.cn/api/v1/images/generations"
headers = {
    "Authorization": "Bearer YOUR_SENSENOVA_API_KEY",
    "Content-Type": "application/json"
}

payload = {
    "model": "SenseNova-U1-Pro",
    "prompt": """Generate a panoramic infographic of the World Cup final from the data below,
                  landscape 8K, with data comparison / timeline / MVP cards:
                  {analysis_json}""",
    "size": "8K-landscape",      # 8K landscape, high information density
    "quality": "delivery",       # Delivery-grade quality
    "n": 1
}

response = requests.post(url, json=payload, headers=headers)
image_url = response.json()["data"][0]["url"]
💡 Tip: U1 Pro natively supports 8K ultra-HD output — text, lines, and icons stay sharp even when the canvas is enlarged, so it holds up in print. That's its biggest gap versus ordinary text-to-image models, which blur the moment you zoom in.
Step 3: Iterate on Text, Graphics, and Details
One of U1 Pro's core strengths is extremely fine-grained control over text, graphics, and details — you can redraw a specific piece of text or a chart locally instead of regenerating the whole image.
Common iteration instructions:
- Change text: change "full-match possession 62% : 38%" to "62.4% : 37.6%"
- Change styling: switch the MVP card to a gold outline
- Change layout: move the timeline from the top to the middle
- Change style: switch from "sports-magazine look" to "flat infographic style"
Each edit only affects the specified region while everything else stays stable — that's the key to the "end AI gacha rerolls" promise.
Step 4: Verify Delivery Quality
Checklist for a delivery-grade infographic:
- Readability: at 50% zoom, all text is still legible
- Data accuracy: every number in the graphic maps one-to-one to the source data
- Logical closure: the narrative order makes sense (background → data → highlights → conclusions)
- Print-ready: 8K output, works in both CMYK and RGB
- No AI look: characters, colors, and layout show none of the typical AI-gacha artifacts
Use Cases: Which Jobs Fit U1 Pro Best
| Scenario | Input | Output |
|---|---|---|
| Commercial information design | Financial reports, market research | Data-dashboard long graphics |
| Commercial visual creation | Brand briefs | Posters, key visuals |
| Explainer knowledge graphics | Technical documents | One-chart explainers |
| Sports/event panoramas | Match data | Full-scene match graphics |
| Film, animation, and digital art | Character sheets | Character posters, concept art |
FAQ
- Text error rate in infographics too high? Let Raccoon structure the data first, then hand it to U1 Pro; feeding long-form natural-language prose directly raises the error rate.
- 8K generation too slow? High-density long graphics typically take 2–5 minutes; route batch jobs through an async queue.
- How is the API billed? By token + image size; see the official pricing page for details: https://www.sensenova.cn/u1-pro.
- Can I generate from plain text without data preprocessing? Yes, but quality drops from "delivery-grade" to "draft-grade."
Related Links
- Official model page: https://www.sensenova.cn/u1-pro
- SenseTime Raccoon infographic feature announcement: https://www.sensetime.com/cn/news/51170637/
- SenseNova Skills AI office skills library (now integrated into Raccoon)
- U1 Pro flagship launch coverage (WAIC, 2026-07-18): https://finance.sina.com.cn/stock/t/2026-07-18/doc-iniiftiz4103891.shtml